What I’ve learned about Time and Timing during my more than two decades as a Financial Advisor
By: John Roland
Published: June 2024
This year marks 26 years for me as a Financial Advisor with Northwestern Mutual and it’s been a great ride thus far. As I reflect on my career as a Financial Advisor, two words come to mind: time and timing. Let me explain.
Clients often ask, “Is now a good time to invest?” Seems straightforward enough, but I suspect what they’re really asking is, “If I invest now, will I have lost money when I need to spend it?” Or, put another way, “Will the money be there in the future to achieve the objective for which it’s intended?” Their concern is about investing ‘now’ versus at some point that *might* be better in the future.
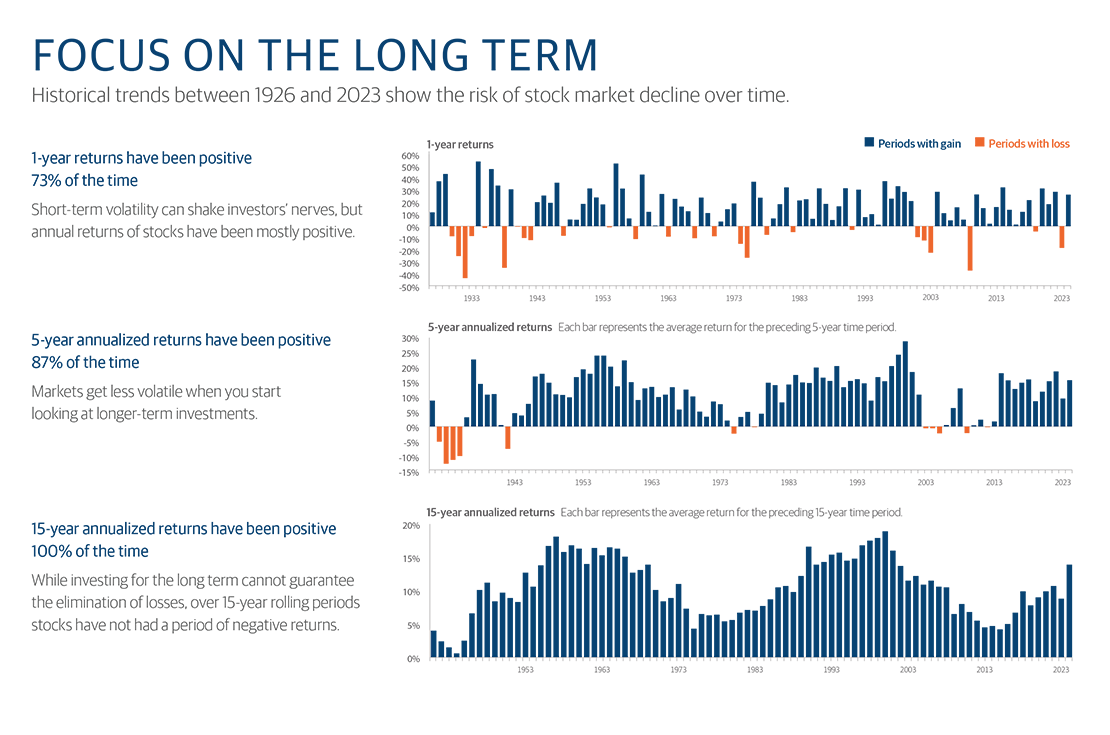
This is where the idea of time comes in. The graphs below demonstrate the year-over-year returns of US Large Cap stocks since 1926. You’ll notice that the longer you held your investment, the better the outcome:
- On a 1-year calendar basis, 73% of the time the result was positive, meaning 27% of the time it wasn’t—about a 1 in 4 chance that you would have lost money if your timeframe for withdrawing the funds was only one year.
- On a 5-year rolling time period, 87% of the time the return was positive, 13% negative. That equates to about a 1 in 8 chance you would have lost money if your timeframe for withdrawing your original investment was 5 years.
- On a 15-year rolling time period, 100% of the time the returns were positive if you stayed invested the entire time. (More on this point in a moment).
This suggests that keeping a long-term focus with your investments, and not panicking during years of market losses, is an important aspect of achieving your financial goals.

Source: 2024 Morningstar Direct. Stocks are represented by the Ibbotson US Large Company Stock Total Return Index from 1926 – 1936 and the S&P 500 Total Return Index from 1937 to present.
The chart is for illustrative purposes only and not intended as a recommendation. Past performance is not a guarantee of future results. All investments carry risk, including potential loss of principal, and no investment strategy can guarantee a profit or completely protect against loss. Indexes are unmanaged and cannot be invested in directly.
This brings me to my second point, timing. You see, those returns over the course of time don’t happen consistently. Every day, month, quarter, and year is different. Interestingly, the returns over longer periods of time boil down to just a few key days. You may be familiar with the Pareto Principle, which states that roughly 80% of effects come from 20% of causes, sometimes referred to as the “80/20 Rule.” But when it comes to market returns, it’s like the Pareto Principle on steroids!
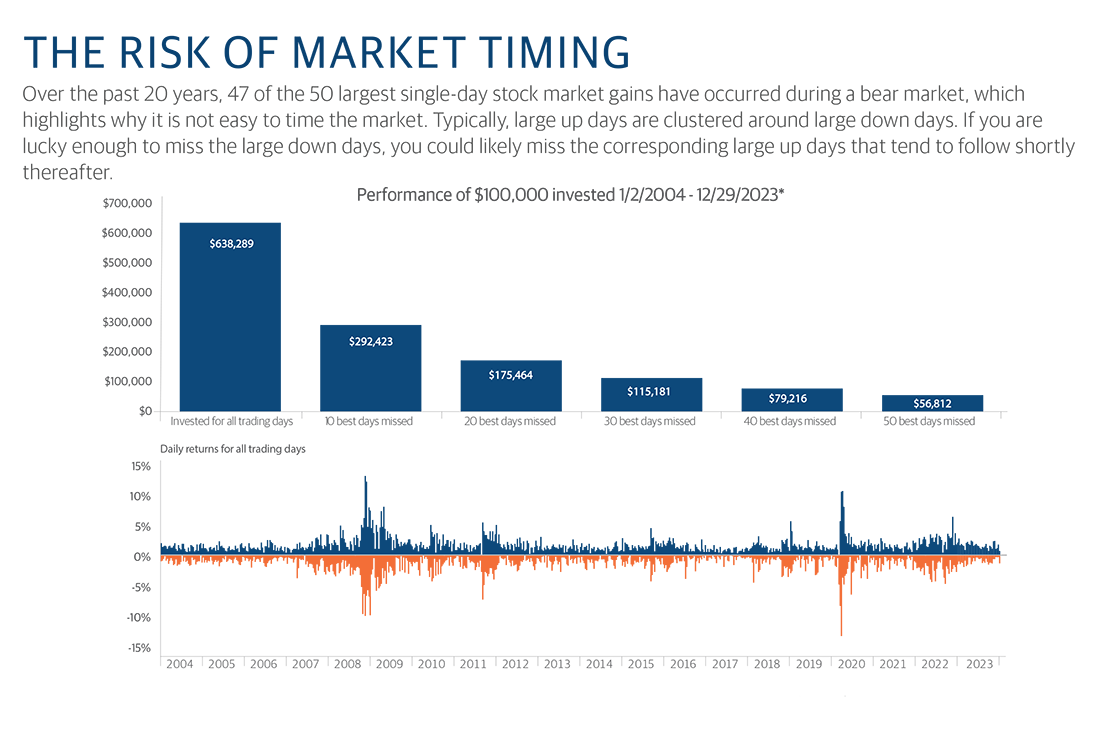
To that point, below is one of the most eye-opening pieces of information I’ve seen in my career. This data shows that just 40 days out of the last 20 years determines the difference between a gain or a loss. That’s 40 days out of 5,035. Put differently, less than one percent, (0.8% to be more precise), of the total trading days accounted for ALL the return—and then some--over two decades of market growth.
If you had been invested every day over the 20 years from January 1st, 2004, through December 31st, 2023, you would have realized an average 9.71% return per year. Had you missed just the best 40 days over those 20 years, your performance would have resulted in an average -1.15% return (notice the negative sign). Put into real dollars:
- If you had $100,000 on January 1st, 2004, with an annualized rate of return of 9.71%, on December 31st, 2023, your account value would have been $638,289.
- If instead you had been out of the market on just those 40 critical days, your $100,000 investment would have been worth $79,216. This would have been a costly mistake that had a real impact on achieving your financial goals.
And something else to remember: during the 20 years highlighted, we experienced a market drawdown of more than 56% from October, 2007 through February 2009, 19% from September through December, 2018, and 33% from February through March, 2020. What a roller coaster ride!

Source: Bloomberg
Stocks represented are annualized total returns of the S&P 500. The chart is for illustrative purposes only and not intended as a recommendation. Past performance is not a guarantee of future results. All investments carry risk, including potential loss of principal, and no investment strategy can guarantee a profit or completely protect against loss.
*Indexes are unmanaged and cannot be invested in directly.
Realistically, the chance that my clients and I are going to be able to accurately predict when the perfect time to invest funds into the stock market is practically zero. Sure, we can say that markets may be overvalued or undervalued relative to previous periods of time, and there’s always a current event that suggests “this time is different.” However, over the past 20 years, and since 1926, there have been times of market overvaluation and undervaluation along with challenging national and global events. Yet had you invested at any point and kept your money in long enough, you would have seen your money grow. While experiencing market losses from time to time, some of which can be severe and nerve-wracking, results in declining account balances, I believe the greater risk to your long-term financial security is missing out on the 0.8% “best days” and foregoing 20 years’ worth of market growth by trying to ‘time’ the market.
When I think about stock market performance so far this year, I’m more convinced than ever that trying to pinpoint the precise “right” moment to invest is an impossible game to win. The best way to set yourself up for investment success is to be diversified, hold for the long term, and not panic during market downturns. “Stay the course” isn’t just a phrase we like to use as financial advisors to calm our clients during market drops, it’s the best way to assure yourself of a lifetime of positive returns.
The opinions expressed are those of John Roland as of the date stated on this material and are subject to change. There is no guarantee that any forecasts made will come to pass. This material does not constitute investment advice and is not intended as an endorsement of any investment or security. Please remember that all investments carry some level of risk, including the potential loss of principal invested. Indexes are unmanaged and cannot be invested in directly. Returns represent past performance and are not a guarantee of future performance. Diversification does not assure profit or protect against loss. John Roland is a financial advisor with the northwestern mutual wealth management company.